Kubernetes provides valuable mechanisms to prevent nodes from being affected when certain pods consume excessive CPU or memory resources, thanks to cgroups. However, memory limits can pose unique challenges. Unlike CPU limits, which can throttle usage over time, memory cannot be gradually restricted. When a container reaches its memory limit, it receives a SIGKILL signal, causing the container to restart.
In my current role, we addressed this by implementing a solution for all our Go applications using the pprof library. By enabling a listening port with pprof, we can retrieve memory heap data from any running process via the /debug/pprof/heap endpoint, which returns a memory heap dump.
We also developed a separate application that continuously monitors memory usage. This application queries the Kubernetes metrics server to check if any container is using more than 80% of its configured memory limit. If this threshold is exceeded, it connects to the pod’s IP on a pre-configured port, retrieves the heap memory data, and stores it in S3 for further analysis using the go tool pprof.
This approach works well for applications with gradual memory leaks, where memory accumulation occurs slowly over time. In such cases, the monitoring service can detect high memory usage and generate a heap dump before the application receives a SIGKILL due to an OOM event.
However, we often encounter cases where memory leaks are more aggressive, with containers jumping from 50 MB to over 1 GB in just a few seconds.
To handle these cases, we implemented a different approach using a library developed by Ricardo Maraschini. This library allows a sidecar container to monitor process metrics in real-time, querying statistics every second instead of the 30-second intervals we had with the metrics server.
We built on this with our custom solution at https://github.com/csepulveda/oom-heap-dumper which enhances Maraschini’s oomhero library by adding functionality to check the app’s listening ports, download the heap from each port, and store it in S3.
Compared to the previous approach, this method introduces some security considerations and may not be suitable for every pod in the system. For this solution to work, we need to enable shareProcessNamespace and set the oom-heap-dumper container privileges with securityContext.privileged: true.
This updated approach allows us to capture a heap memory dump and send it to S3 for later analysis, even when memory spikes occur rapidly.
Practical Example
Consider the following code, which forces a memory leak by doubling memory usage with each iteration: code
When running this application in a container on our Kubernetes cluster, we observe the following results:
Deployment Configuration:
apiVersion: apps/v1
kind: Deployment
metadata:
  name: go-memory-leak
  namespace: default
spec:
  replicas: 1
  selector:
    matchLabels:
      app: go-memory-leak
  template:
    metadata:
      labels:
        app: go-memory-leak
    spec:
      containers:
        - name: app
          image: ghcr.io/csepulveda/go-memory-leak:v0.0.3
          resources:
            requests:
              memory: 64Mi
              cpu: 250m
            limits:
              memory: 240Mi
              cpu: 250m
Memory Stats:
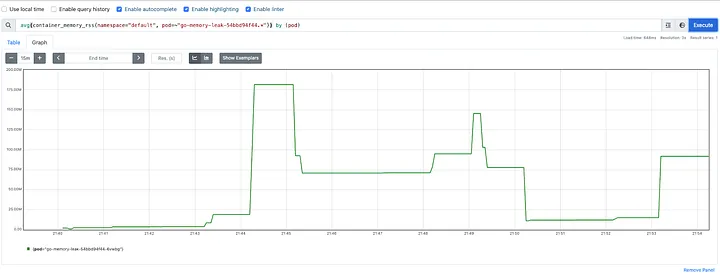
App Logs and OOM events:
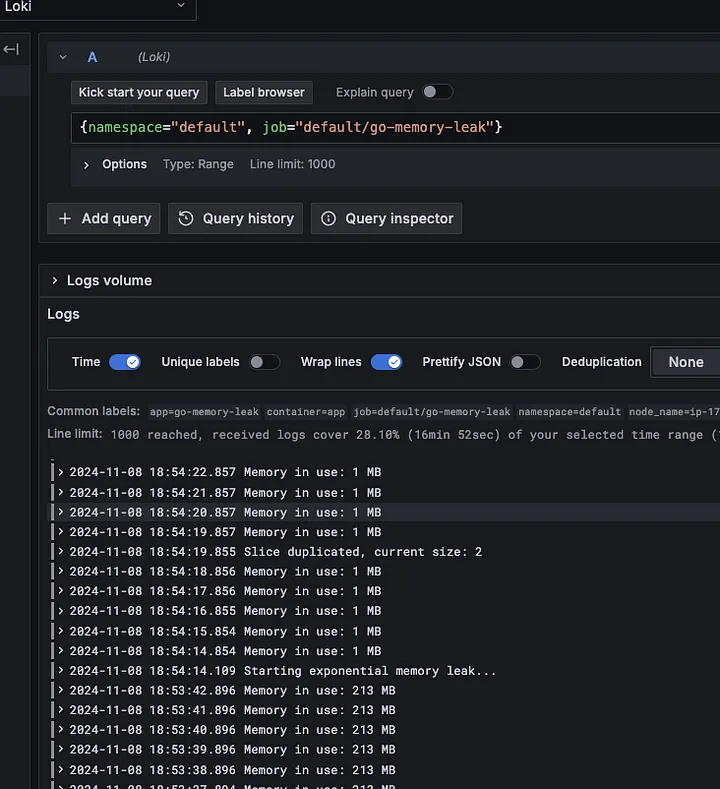

As shown, monitoring the metric server directly and attempting to take a memory dump when usage exceeds 80% is challenging. With each cycle doubling memory usage, we go from 50% to nearly 100% in one jump. These rapid changes make it difficult for the metric server to capture and respond to fluctuations in real-time.
To address this, our first step is to add pprof middleware to our application.
Using the Sidecar to auto generate the Heap File
Code Comparison:
https://github.com/csepulveda/go-memory-leak/compare/v0.0.3…v0.0.4
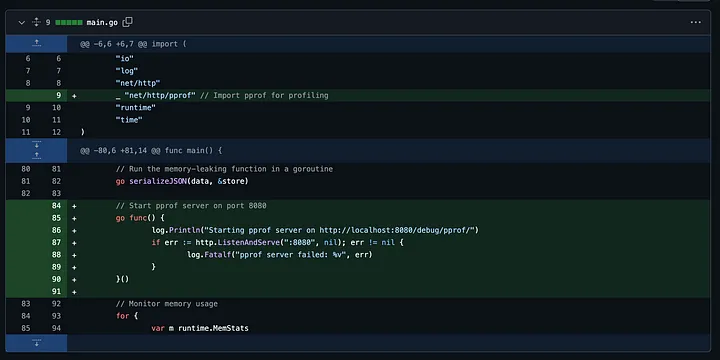
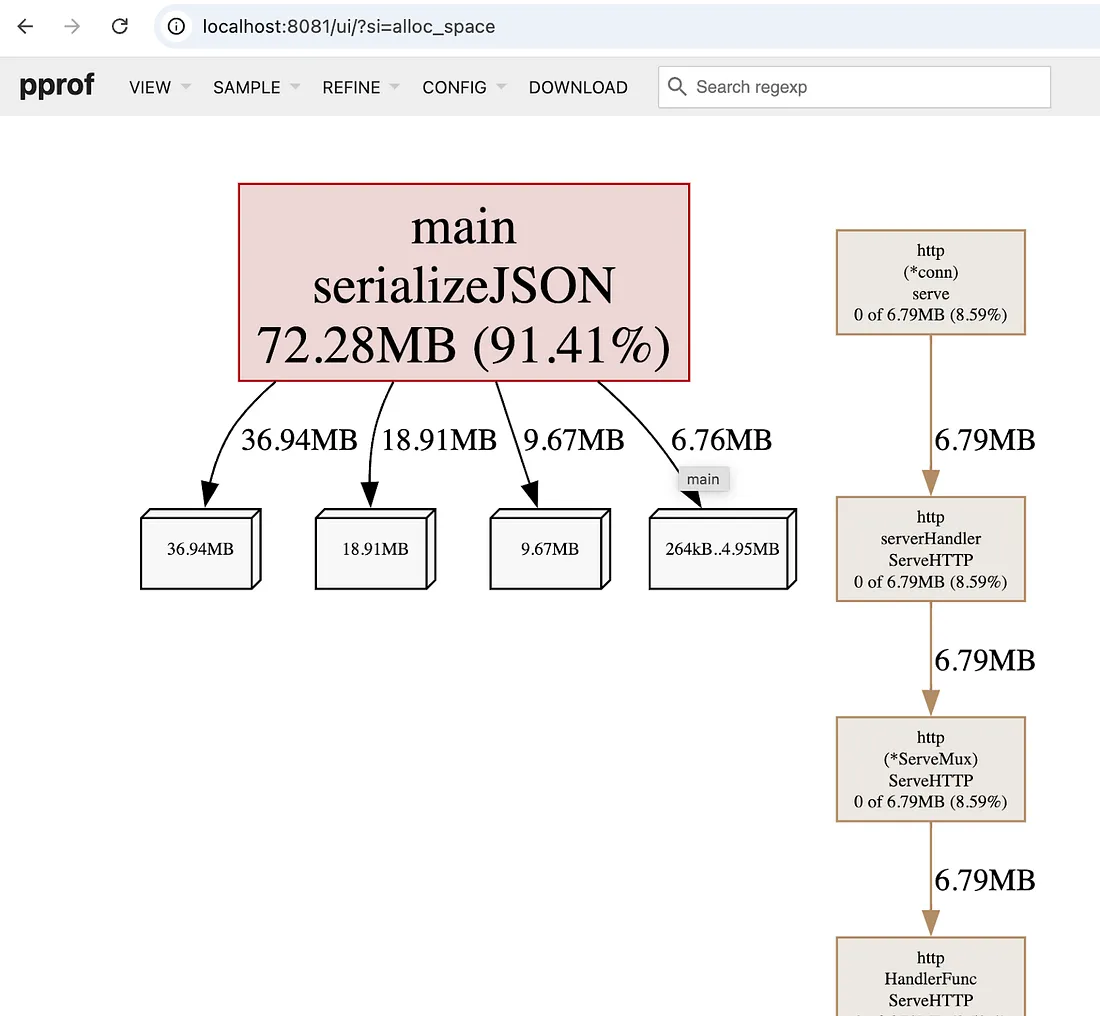
This enables us to retrieve the application’s memory heap, allowing us to analyze it locally. For example, if the app is running on port 8080, we can launch the pprof web interface on port 8081 to analyze the heap file:
go tool pprof -http=:8081 localhost:8080/debug/pprof/heap
Through this analysis, we can see the memory leak originates within the main function, specifically when calling serializeJSON.
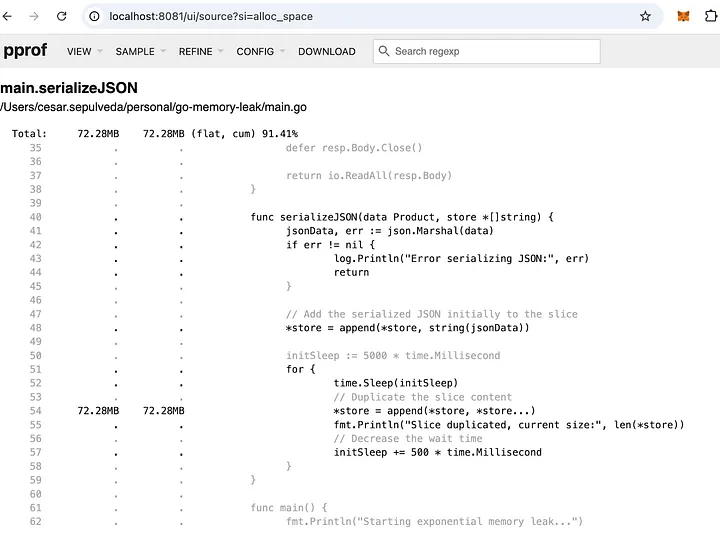
For this example, replicating the memory leak behavior is straightforward. However, in cases where memory leaks occur sporadically, capturing a memory dump at the exact moment of high memory usage is essential. This is where our sidecar solution becomes invaluable.
Deployment Configuration to Add the Sidecar:
apiVersion: apps/v1
kind: Deployment
metadata:
  name: go-memory-leak
  namespace: default
spec:
  replicas: 1
  selector:
    matchLabels:
      app: go-memory-leak
  template:
    metadata:
      labels:
        app: go-memory-leak
    spec:
      shareProcessNamespace: true
      containers:
        - name: app
          image: ghcr.io/csepulveda/go-memory-leak:v0.0.4
          resources:
            requests:
              memory: 64Mi
              cpu: 250m
            limits:
              memory: 130Mi
              cpu: 250m
        - name: oom-heap-dump
          image: ghcr.io/csepulveda/oom-heap-dumper:v0.0.5
          securityContext:
            privileged: true
          env:
          - name: CRITICAL
            value: "70"
          - name: COOLDOWN
            value: "10s"
          - name: WATCH_TIME
            value: "100ms"
          - name: BUCKET
            value: "bucket-name"
          - name: AWS_REGION
            value: "us-west-1"
          - name: AWS_ACCESS_KEY_ID
            value: "xxx"
          - name: AWS_SECRET_ACCESS_KEY
            value: "yyy"
          - name: AWS_SESSION_TOKEN
            value: "zzz"
In this YAML, the keys and bucket name are masked for security, but it’s possible to pass credentials directly as environment variables or use a service account that grants write permissions to the bucket where memory heaps will be stored. For more on setting permissions, check out my post on configuring IAM roles with service accounts: how to define iam roles on eks
When the app is running, you’ll see logs from our oom-dumper once it reaches the 70% memory threshold set as the maximum memory usage.


Retrieving and Visualizing the Heap
Download the heap from S3 and view it locally:
aws s3 cp s3://xxxx/go-memory-leak-54d6d47d7-6hl64-7-8080-2024-11-11-03-49.heap .
download: s3://xxxx/go-memory-leak-54d6d47d7-6hl64-7-8080-2024-11-11-03-49.heap to ./go-memory-leak-54d6d47d7-6hl64-7-8080-2024-11-11-03-49.heap

go tool pprof -http=:8081 go-memory-leak-54d6d47d7-6hl64-7-8080-2024-11-11-03-49.heap
Review the memory heap from the web interface provided by go tool pprof.

Conclusion
Using go tool pprof, we can manually capture memory heaps during OOM events. Setting up the pprof wrapper for on-demand heaps is relatively straightforward. However, capturing a heap at a specific high-memory usage moment can be challenging. For these cases, monitoring tools that automatically generate/store heaps can be invaluable, making the csepulveda/oom-heap-dumper sidecar an effective tool for managing memory dumps in high-demand situations.
